Matplotlib 子图
显示多个图表
通过 subplot() 函数,您可以在一个图形中绘制多个图表:
实例
绘制 2 个图表:
import matplotlib.pyplot as plt
import numpy as np

# 图表 1:
x = np.array([0, 1, 2, 3])
y = np.array([3, 8, 1, 10])

plt.subplot(1, 2, 1)
plt.plot(x,y)

# 图表 2:
x = np.array([0, 1, 2, 3])
y = np.array([10, 20, 30, 40])

plt.subplot(1, 2, 2)
plt.plot(x,y)

plt.show()
结果:

subplot() 函数
subplot() 函数接受三个参数,这些参数描述了图形的布局。
布局以行和列组织,分别由第一个和第二个参数表示。
第三个参数表示当前图表的索引。
plt.subplot(1, 2, 1)
# 图形有 1 行,2 列,这个图表是第一个图表。
plt.subplot(1, 2, 2)
# 图形有 1 行,2 列,这个图表是第二个图表。
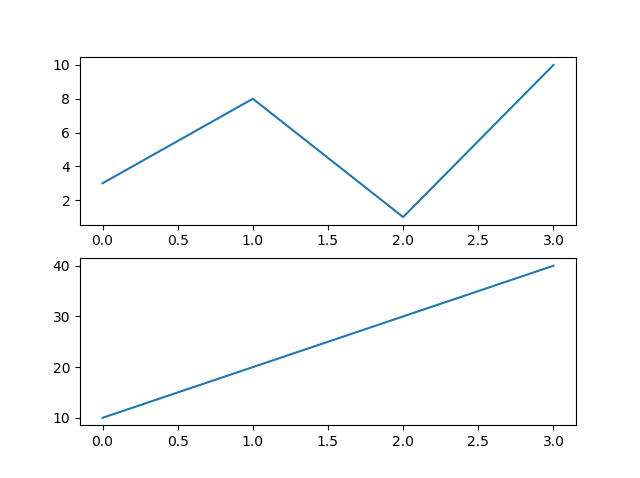
因此,如果我们想要一个具有 2 行 1 列的图形(意味着两个图表将上下显示而不是并排显示),我们可以这样写语法:
实例
上下显示 2 个图表:
import matplotlib.pyplot as plt
import numpy as np

# 图表 1:
x = np.array([0, 1, 2, 3])
y = np.array([3, 8, 1, 10])

plt.subplot(2, 1, 1)
plt.plot(x,y)

# 图表 2:
x = np.array([0, 1, 2, 3])
y = np.array([10, 20, 30, 40])

plt.subplot(2, 1, 2)
plt.plot(x,y)

plt.show()
结果:
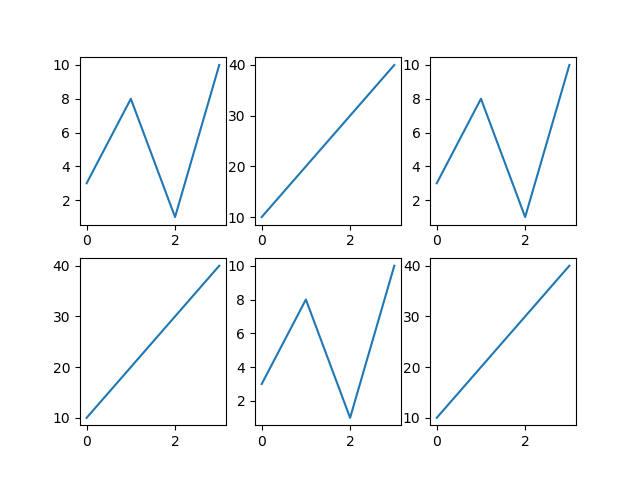
您可以在一个图形上绘制任意数量的图表,只需描述行数、列数和图表的索引即可。
实例
Draw 6 plots:
import matplotlib.pyplot as plt
import numpy as np

x = np.array([0, 1, 2, 3])
y = np.array([3, 8, 1, 10])

plt.subplot(2, 3, 1)
plt.plot(x,y)

x = np.array([0, 1, 2, 3])
y = np.array([10, 20, 30, 40])

plt.subplot(2, 3, 2)
plt.plot(x,y)

x = np.array([0, 1, 2, 3])
y = np.array([3, 8, 1, 10])

plt.subplot(2, 3, 3)
plt.plot(x,y)

x = np.array([0, 1, 2, 3])
y = np.array([10, 20, 30, 40])

plt.subplot(2, 3, 4)
plt.plot(x,y)

x = np.array([0, 1, 2, 3])
y = np.array([3, 8, 1, 10])

plt.subplot(2, 3, 5)
plt.plot(x,y)

x = np.array([0, 1, 2, 3])
y = np.array([10, 20, 30, 40])

plt.subplot(2, 3, 6)
plt.plot(x,y)

plt.show()
结果:
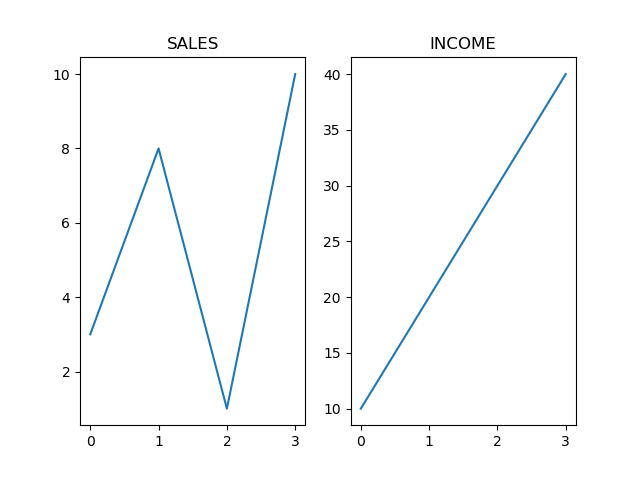
标题
您可以使用 title() 函数为每个图表添加标题:
实例
2 plots, with titles:
import matplotlib.pyplot as plt
import numpy as np

# 图表 1:
x = np.array([0, 1, 2, 3])
y = np.array([3, 8, 1, 10])

plt.subplot(1, 2, 1)
plt.plot(x,y)
plt.title("销售")

# 图表 2:
x = np.array([0, 1, 2, 3])
y = np.array([10, 20, 30, 40])

plt.subplot(1, 2, 2)
plt.plot(x,y)
plt.title("收入")

plt.show()
结果:
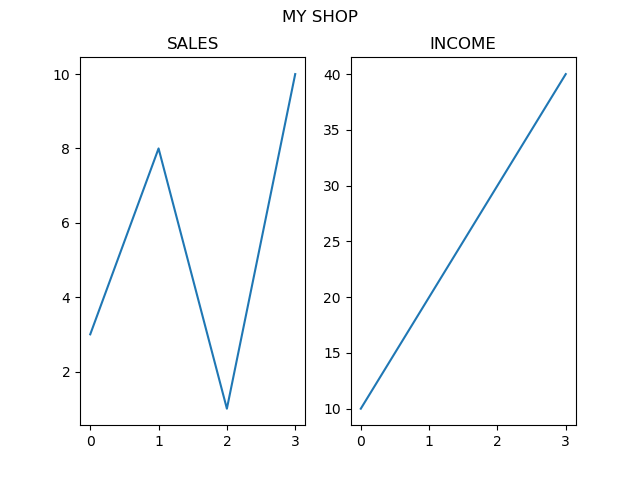
总标题
您可以使用 suptitle() 函数为整个图形添加标题:
实例
为整个图形添加标题:
import matplotlib.pyplot as plt
import numpy as np

# 图表 1:
x = np.array([0, 1, 2, 3])
y = np.array([3, 8, 1, 10])

plt.subplot(1, 2, 1)
plt.plot(x,y)
plt.title("销售")

# 图表 2:
x = np.array([0, 1, 2, 3])
y = np.array([10, 20, 30, 40])

plt.subplot(1, 2, 2)
plt.plot(x,y)
plt.title("收入")

plt.suptitle("我的商店")
plt.show()
结果: